Test environment and hardware
| Item | Tested configuration |
| Test date | 2026-10-02 |
| Operating system | Ubuntu 24.04.5 LTS, amd64 |
| Test hosts | 1 fresh isolated VM(s); resources below are per VM |
| CPU | 2 vCPU |
| Memory | 4 GiB |
| System disk | 32 GiB, HDD-backed, VirtIO, ext4 |
| Linux kernel | 6.8.0-139-generic |
| PostgreSQL | 16.15, native Ubuntu packages |
Use a real long-running test query and concurrent transactions to observe activity, identify blockers, release waits, and compare plans before and after adding an index.
On this page
This tutorial was tested on fresh, isolated Ubuntu 24.04 virtual machines with synthetic data. Packages came from signature-verified sources for Noble. No production database or website credentials were used. Check the sources and versions appropriate for your own environment.
The screenshots show actual bash PTY output from the test machines, rendered in a browser terminal view. The prompt is normalized to lab$; results were not rewritten. This English edition preserves the tested commands and original images. Some code comments, sample strings, and screenshot footers remain in Traditional Chinese. Copyable commands are provided separately.
First complete the native PostgreSQL installation. This series uses the demo database; where a sample table is required, follow the migration tutorial to create 100 synthetic rows. Work in an isolated learning environment.
1. Inspect active sessions
The administrator inspects statistics filtered by application_name to include only tagged synthetic work. A production monitor should receive a dedicated monitoring role as needed; database superuser credentials do not belong in ordinary websites.
SELECT application_name, state, wait_event_type, wait_event
FROM pg_stat_activity
WHERE application_name='lab_slow_query';
Run this SQL in a separate test connection to observe a genuinely waiting query in pg_stat_activity. Other users’ SQL and source IPs were not collected or published.
SET application_name='lab_slow_query';
SELECT pg_sleep(30);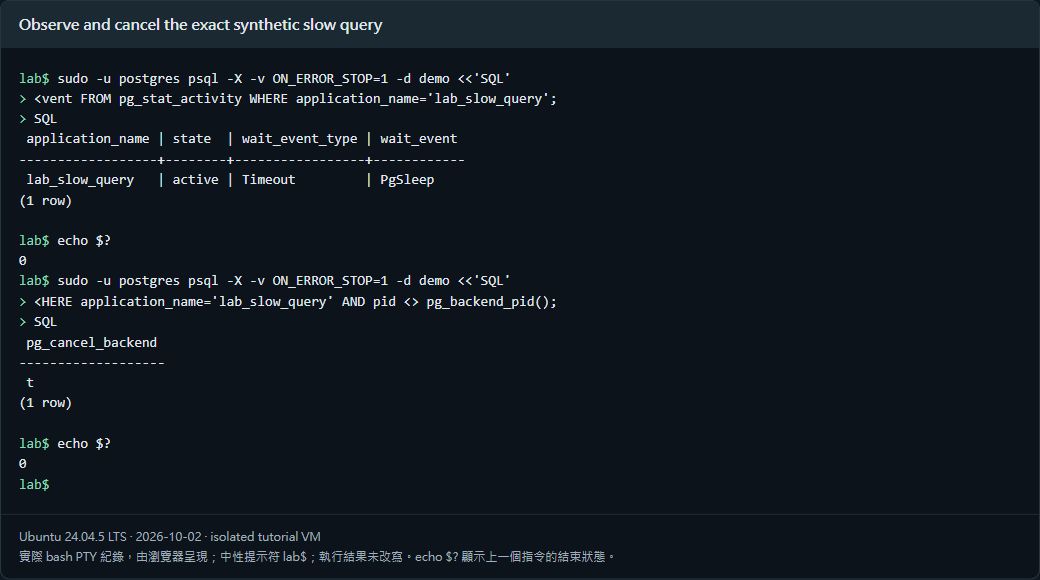
To finish this test, cancel only the PID with the exact test tag, excluding the current connection:
SELECT pg_cancel_backend(pid)
FROM pg_stat_activity
WHERE application_name='lab_slow_query'
  AND pid <> pg_backend_pid();
pg_cancel_backend cancels the current query rather than forcibly terminating the session. Never remove the filter and apply it to every PID. Check ownership and business impact before intervention in production.
2. Create a real lock wait with two transactions
Open two teaching sessions. Run session A and leave its transaction open:
SET application_name='lab_blocker';
BEGIN;
UPDATE sample SET note='held' WHERE id=1;
Session B updates the same row and waits for A:
SET application_name='lab_waiter';
UPDATE sample SET note='released' WHERE id=1;
Inspect them from a third administrator connection:
SELECT application_name, wait_event_type,
       cardinality(pg_blocking_pids(pid)) AS blockers
FROM pg_stat_activity
WHERE application_name IN ('lab_blocker','lab_waiter')
ORDER BY application_name;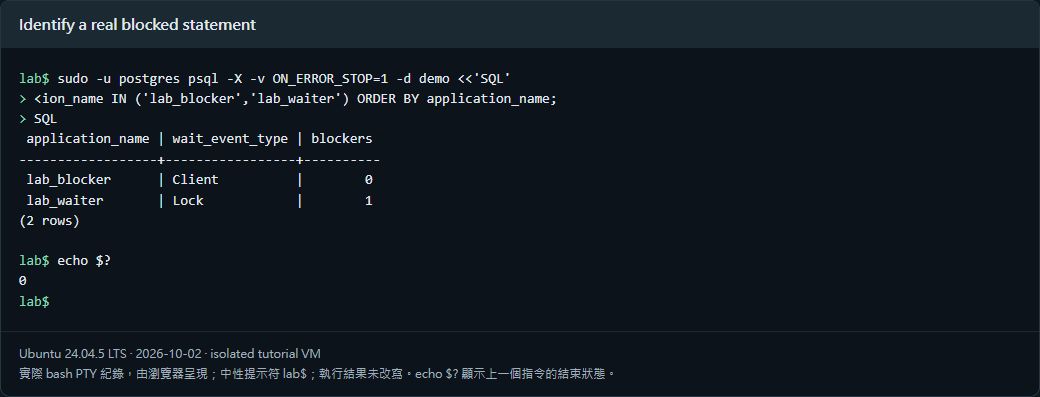
The waiting session showed wait_event_type=Lock and one blocking source. Executing ROLLBACK in A let B’s UPDATE actually finish. All data was synthetic; other services’ sessions were not canceled or terminated.
3. Configure a slow-query threshold and verify the log
ALTER SYSTEM SET log_min_duration_statement='200ms';
SELECT pg_reload_conf();
SELECT pg_sleep(0.3);
PostgreSQL’s native log recorded the 0.3-second synthetic query. 200ms is a teaching threshold; size it for production load and log capacity. Logs can contain SQL, parameters, and personal data. Publish only reviewed test summaries, not raw production logs.
Restore the default setting after the test:
ALTER SYSTEM RESET log_min_duration_statement;
SELECT pg_reload_conf();
4. Inspect the plan, not just index existence
CREATE TABLE plan_sample AS
SELECT n AS id, repeat('x',100) AS note FROM generate_series(1,10000) n;
ANALYZE plan_sample;
EXPLAIN (ANALYZE, BUFFERS)
SELECT * FROM plan_sample WHERE id=5000;
CREATE INDEX plan_sample_id_idx ON plan_sample(id);
EXPLAIN (ANALYZE, BUFFERS)
SELECT * FROM plan_sample WHERE id=5000;
For 10,000 synthetic rows, the plan changed from Seq Scan to Index Scan. This proves functionality, not a production speedup ratio. EXPLAIN ANALYZE actually executes the statement. This example uses SELECT; avoid experimenting with writing statements on production data.
5. Turn observations into useful answers
Check for running long queries, waits on other transactions, actual slow-query records, and expected plans. The waiting update finished after the test lock was released; service and data checks also passed after reboot.
Verified results
| Verification | Result |
| Real pg_sleep visible in activity statistics | Passed |
| Only the tagged test query canceled | Passed |
| Real UPDATE had one blocker | Passed |
| Waiting UPDATE completed after ROLLBACK | Passed |
| 200ms threshold logged a 0.3-second query | Passed |
| Seq Scan and Index Scan checked with 10,000 rows | Passed |
Scope: synthetic slow queries, real transaction blocking, logging, and plans before and after an index. This was not a load test. Grafana and Prometheus were not installed, and no throughput or latency guarantee is claimed.
Official references
www.postgresql.org/docs/16/monitoring-stats.html · www.postgresql.org/docs/16/runtime-config-logging.html · www.postgresql.org/docs/16/using-explain.html